Logging in lands you on the Dashboard. It is a summary screen: four headline counters, a week of movement in two charts, the visitors due or already on site, and a feed of everything the system has just recorded. Nothing on it is edited here, so it is safe to leave open on a screen at reception.
Before you start: what you see depends on your permissions. The counters, the charts and the events feed need event and reporting rights; the visitors panel needs permission to see visitors. If a panel described here is missing for you, your account does not have that right.
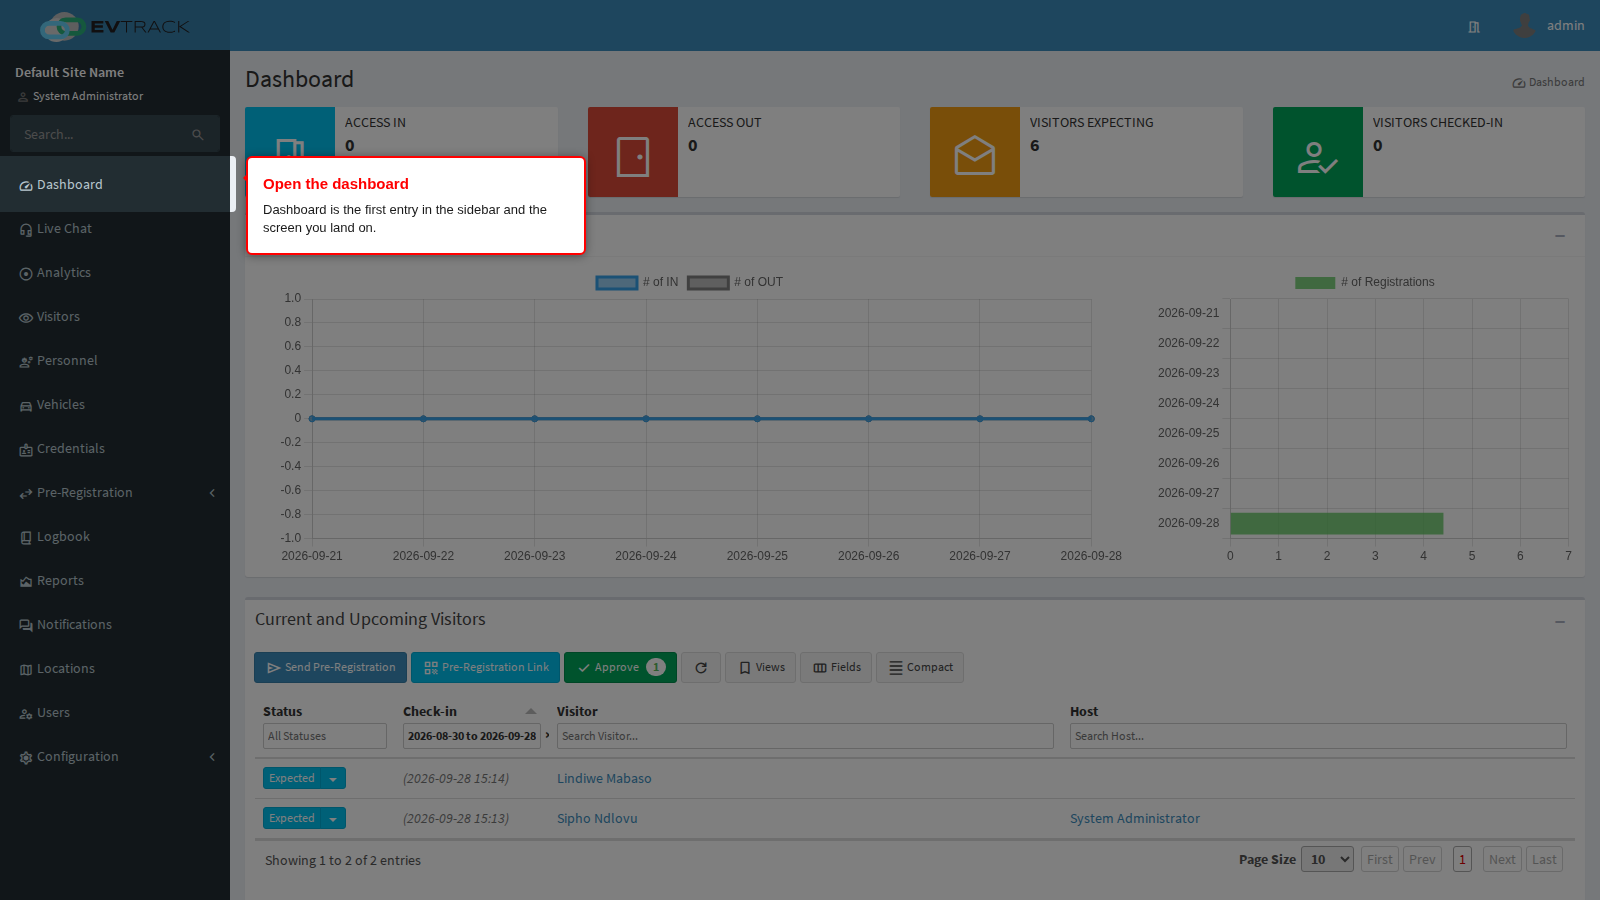
Step 1: Open the dashboard
Dashboard is the first entry in the left sidebar, and it is where you land after logging in. Click it from anywhere in the product to come back.
Step 2: Read the four counters
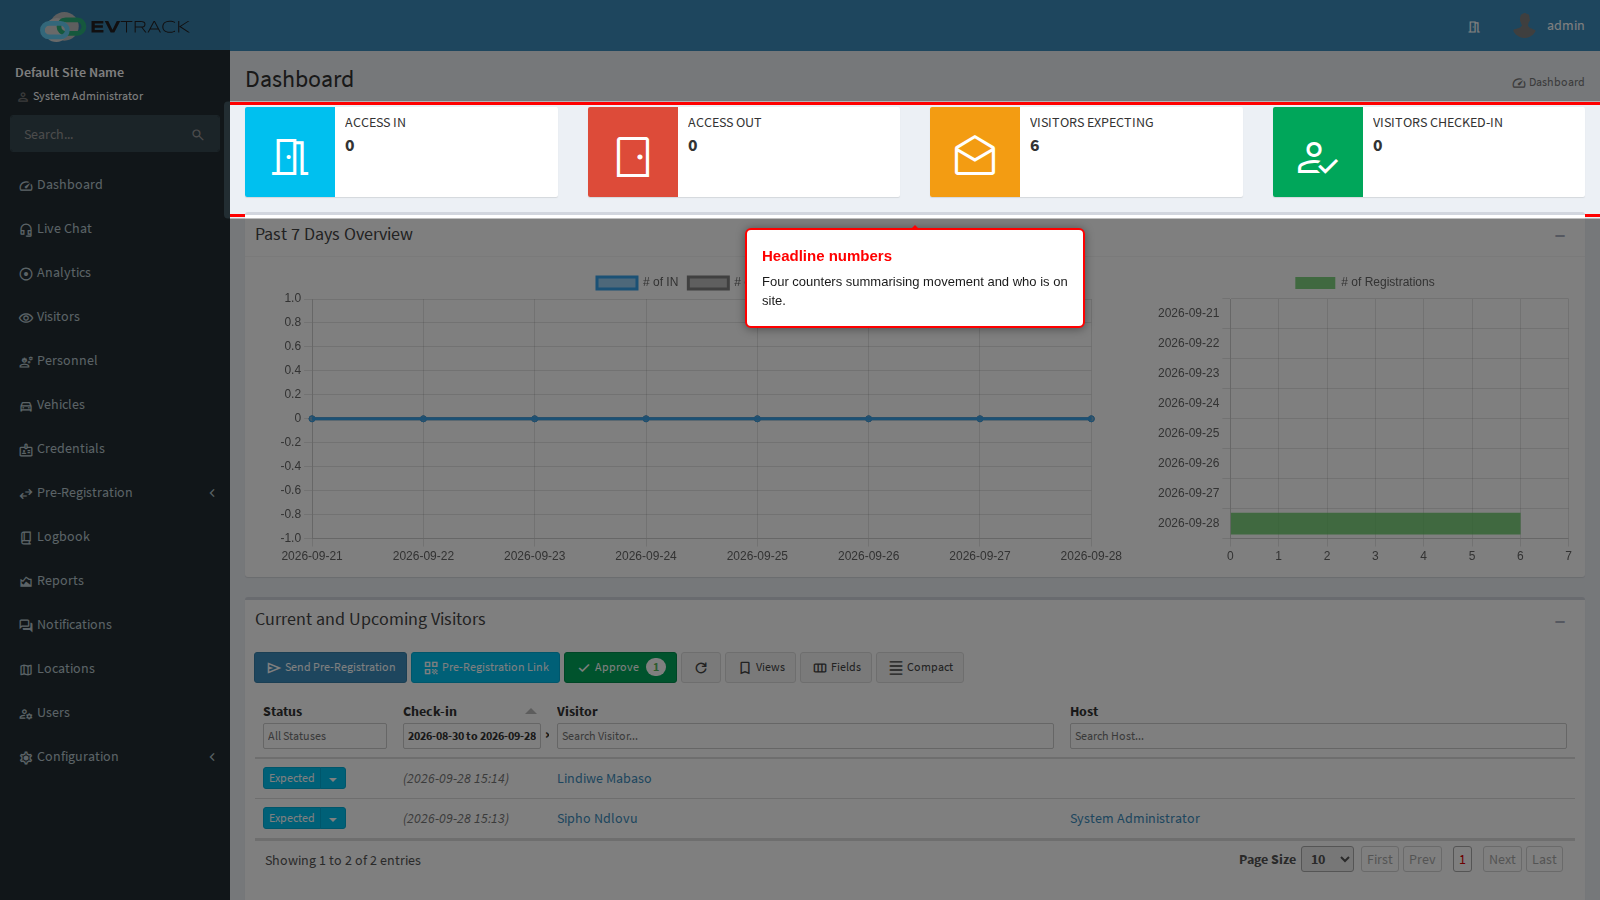
They do not all cover the same period, which matters when you compare them:
- Access IN - the number of entry readings recorded today. It resets at midnight in your configured system time zone.
- Access OUT - the same for exits, also today only.
- Visitors Expecting - a running total of visits currently at the Expected status. This is not a today figure: an invitation for next week is already counted here.
- Visitors Checked-in - how many visitors are on site right now, counting everyone checked-in, on site, in parking or with a host. Also a running total rather than a daily one.
So the first two answer “how busy were the doors today”, and the last two answer “who is in the building, and who is still coming”.
The counters are read once when the page loads. They do not tick over by themselves, so reload the page for fresh numbers. They are also read-only: clicking a counter does nothing, and the detail behind them lives on the Visitor Dashboard and in Reports.
Step 3: Read the seven-day trend
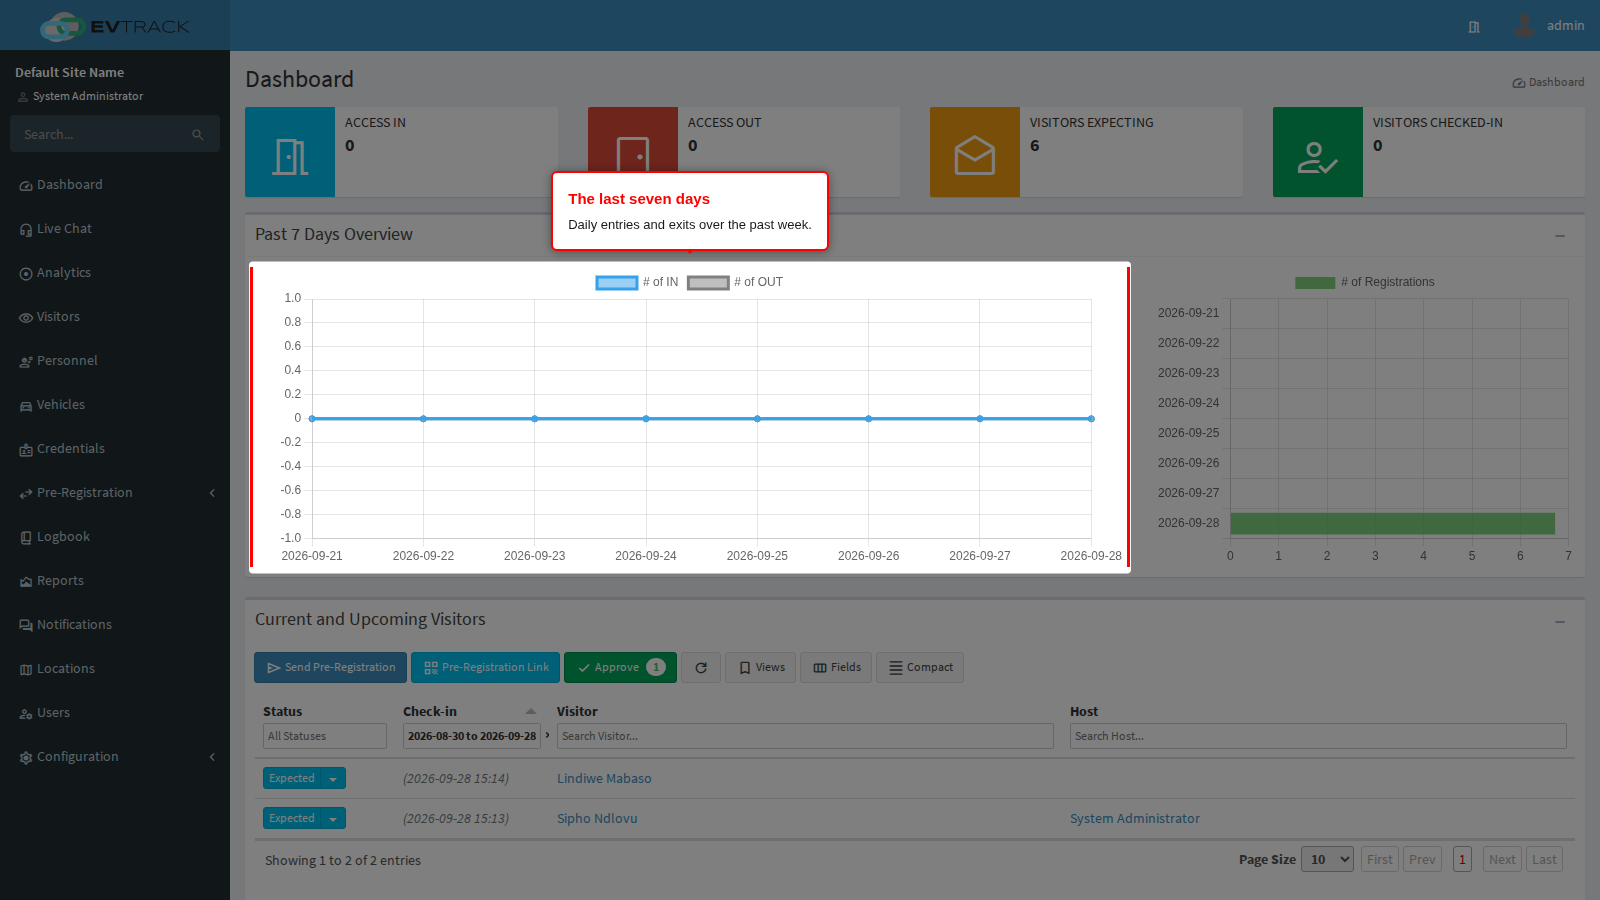
Below the counters, Past 7 Days Overview puts the last week in context with two charts side by side:
- a line chart of access granted, in and out, one point per day, so a quiet day or an unusually busy one stands out; and
- a bar chart of new visitor registrations over the same seven days.
Both cover today and the six days before it, in your configured system time zone.
Step 4: See who is coming and who is here
Current and Upcoming Visitors is a short version of the visitor dashboard. It lists the visits that are expected or already checked in, with the status, the check-in time, the visitor and the host.
You can work from it directly: the status column filter and the visitor and host search boxes work exactly as they do on the full dashboard, and clicking the coloured status pill opens the actions available on that visit. A Refresh button sits beside the paging controls at the bottom of the panel.
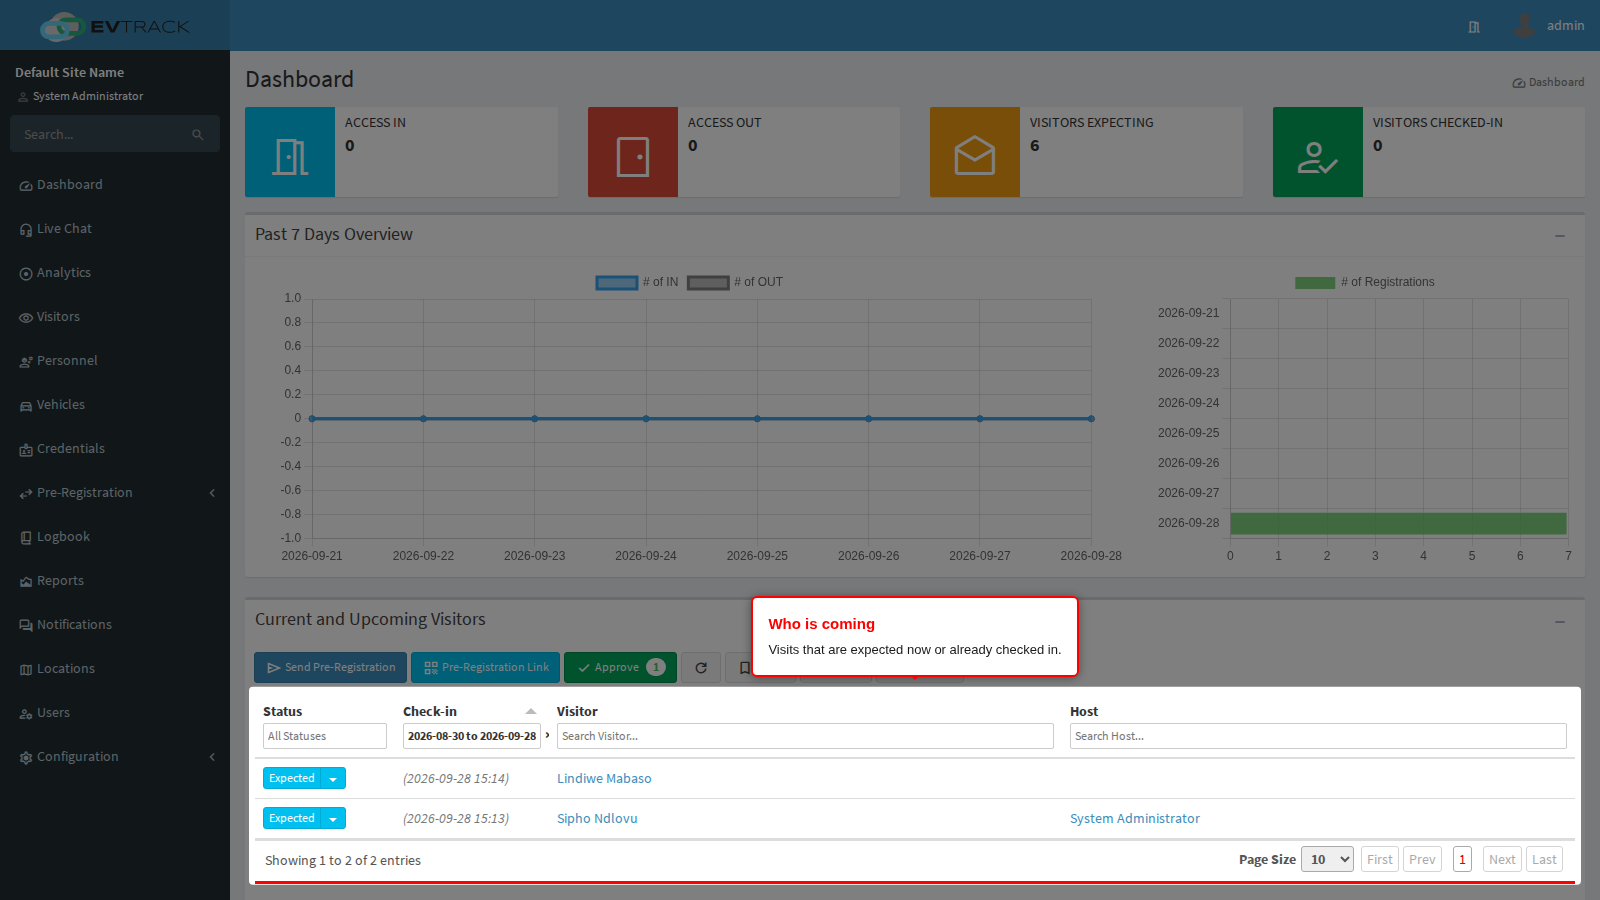
When self-registration is switched on, three buttons appear above this panel:
- Send Pre-Registration - email a visitor an invitation to register themselves before they arrive.
- Pre-Registration Link - show the self-registration link and its QR code so you can copy it, WhatsApp it or email it.
- Approve - jump to the registration requests waiting for a decision. When something is waiting, the button turns green and shows the number.
For the full list, every column and the bulk actions, use The Visitor Dashboard.
Step 5: Read the events feed
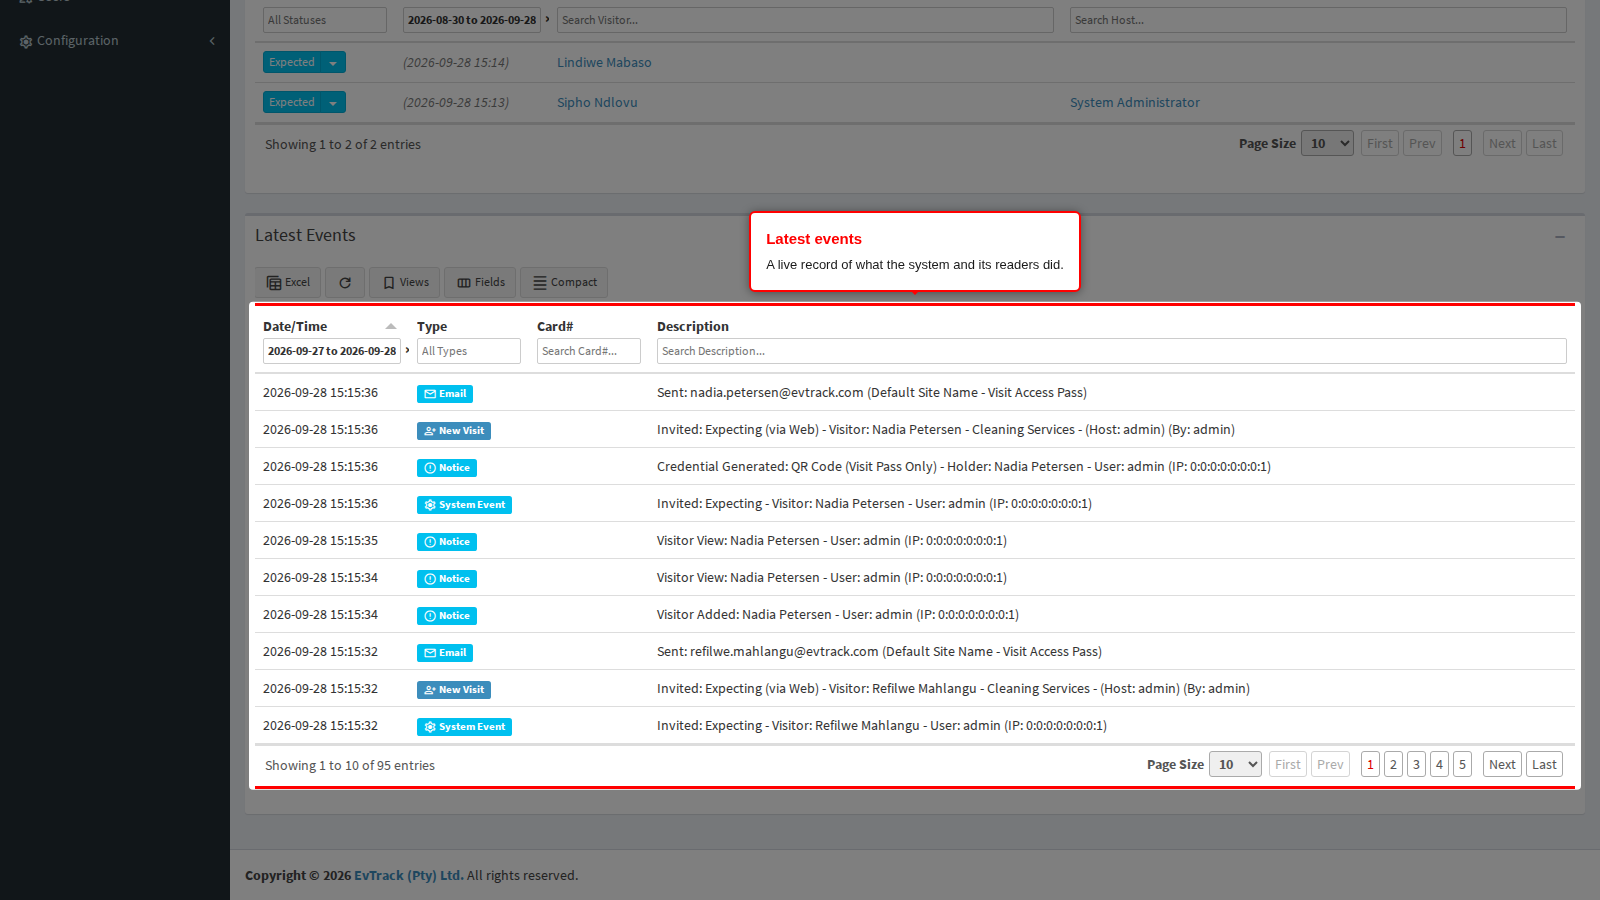
Latest Events is the running record of what the system did: credentials presented at the checkpoint, access granted and denied, alarms, door events, watchlist matches, registrations, and the messages sent out by email, SMS and WhatsApp.
Each row shows the date and time, a coloured badge for the event type, the card or credential number involved, and a description. Where a reader reports a temperature, a temperature column appears automatically.
Step 6: Change the time window
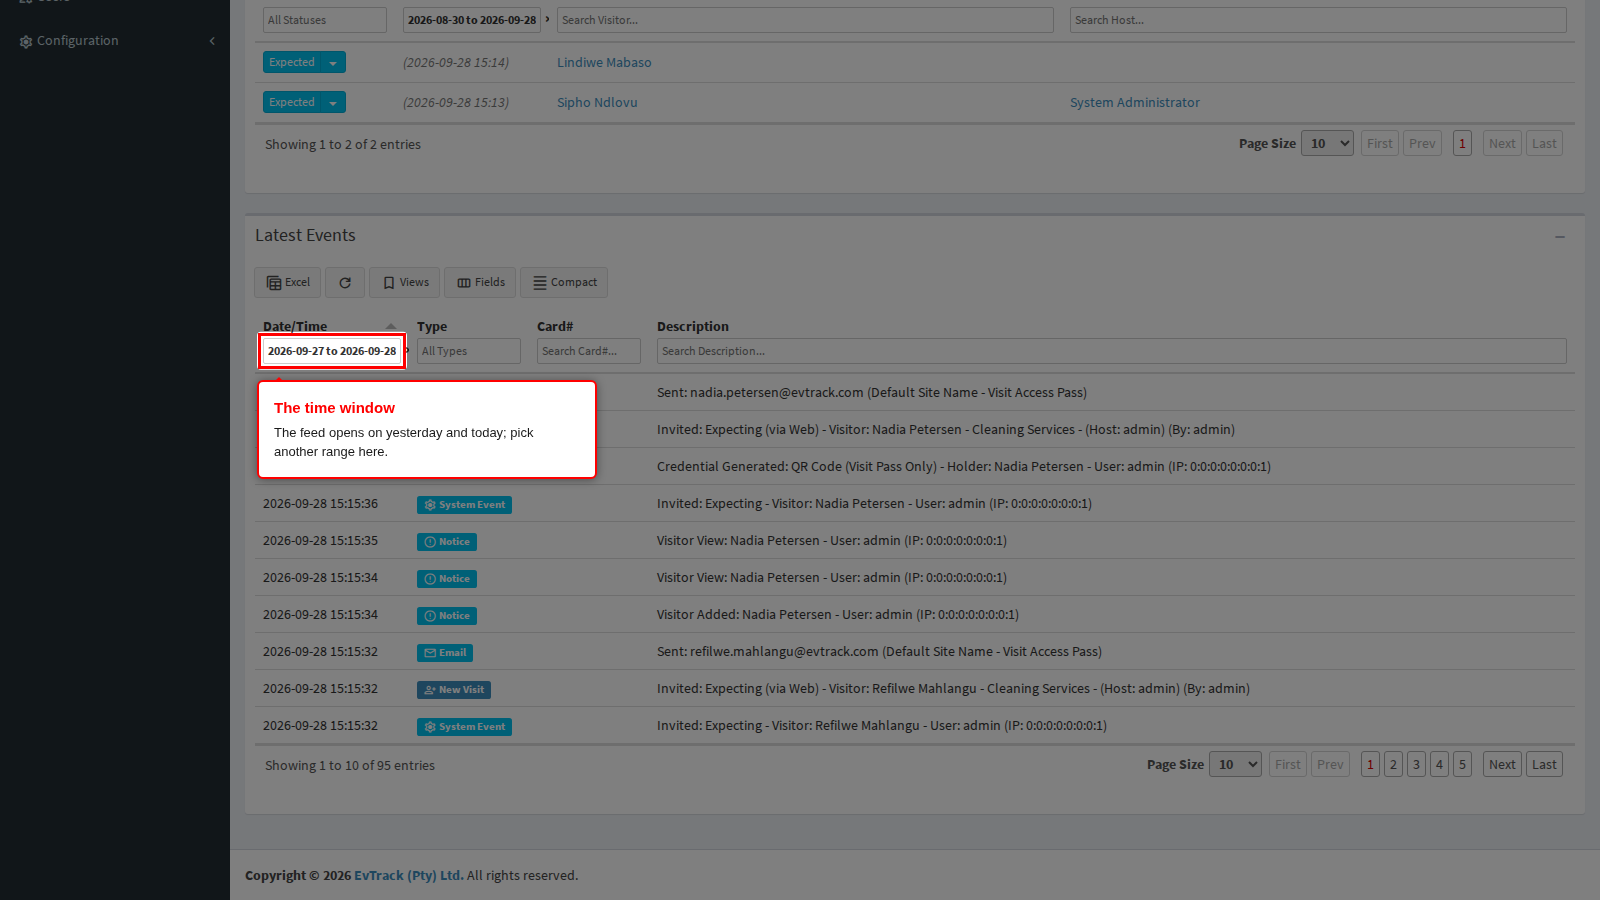
The feed opens on yesterday and today. To look at another period, click the date box under the Date/Time column heading and pick a from and a to date. The x beside it clears your choice and puts the default window back.
The window is limited to seven days. If you pick a wider range it is trimmed for you. This is deliberate: the events table is the largest in the system, and an open-ended query would take a long time to come back. For anything longer, use Reports.
You can also filter the feed by:
- Type - a dropdown of every event type, so you can look at access denials alone, for example.
- Card# and Description - free-text boxes. Type at least three characters before the search runs.
Step 7: Refresh
The feed is loaded once when the page opens. It does not stream new events in by itself, so click Refresh above the table to pull in anything that has happened since. Changing a filter, sorting a column or paging also fetches fresh data.
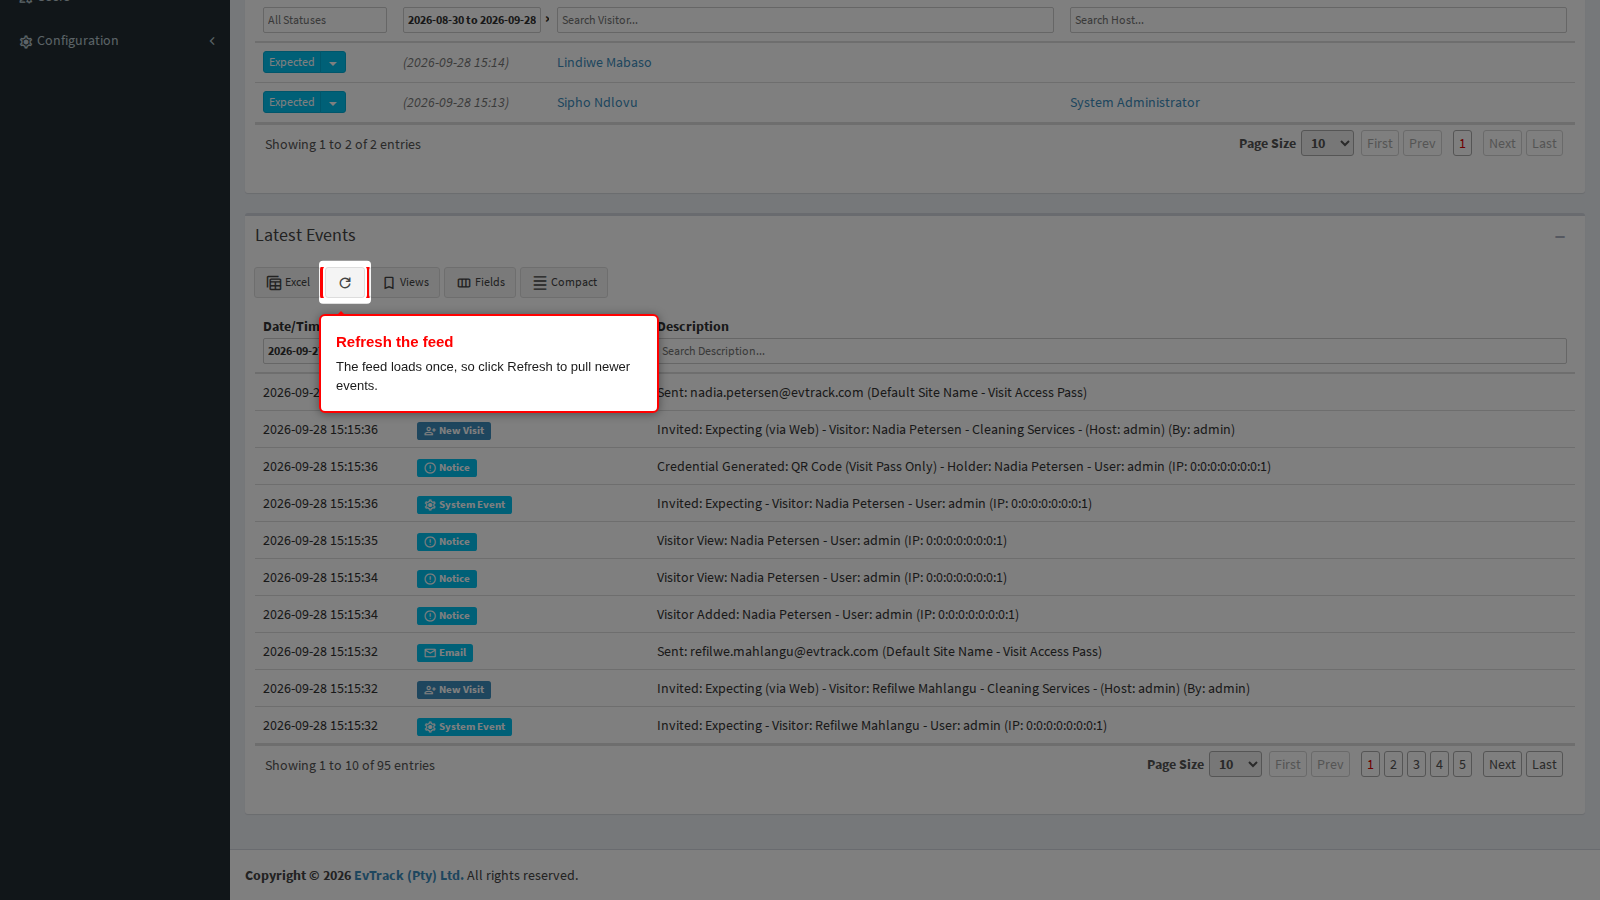
The Excel button next to it downloads the events matching your current filters as a spreadsheet. Larger exports show a progress message while the rows are collected.
Related pages
- The Visitor Dashboard - the full visit list with bulk actions
- Check-in and Check-out - moving a visit through its statuses
- Global Search - finding a person or a credential from anywhere
- Reports - longer periods and printable output