EvTrack can report server errors to Sentry - a hosted or self-managed error-monitoring service - so your support team sees stack traces and error trends without shell access to the onsite server. Reporting is off until a DSN is configured.
Before you start: create a project in your Sentry organisation (platform: Java/Spring Boot) and copy its DSN - the https://...@...ingest.../... address on the project’s settings page.
Step 1: Configure the DSN on the server
Error reporting is configured on the server itself, not in the web UI. Set the DSN as an environment variable for the EvTrack service and restart it:
SENTRY_DSN- the project DSN (leaving it empty keeps reporting disabled)SENTRY_DEBUG- optional;truemakes the server log its own reporting activity while you verify the setup, then set it back tofalse
On a Windows onsite server, set the variables in the service environment and restart the EvTrack service; on Linux, add them to the service unit or environment file and restart.
By default the server reports events of level warning and above, keeps up to 150 breadcrumbs per event, and samples 10 percent of performance traces.
Step 2: Verify on the Telemetry page
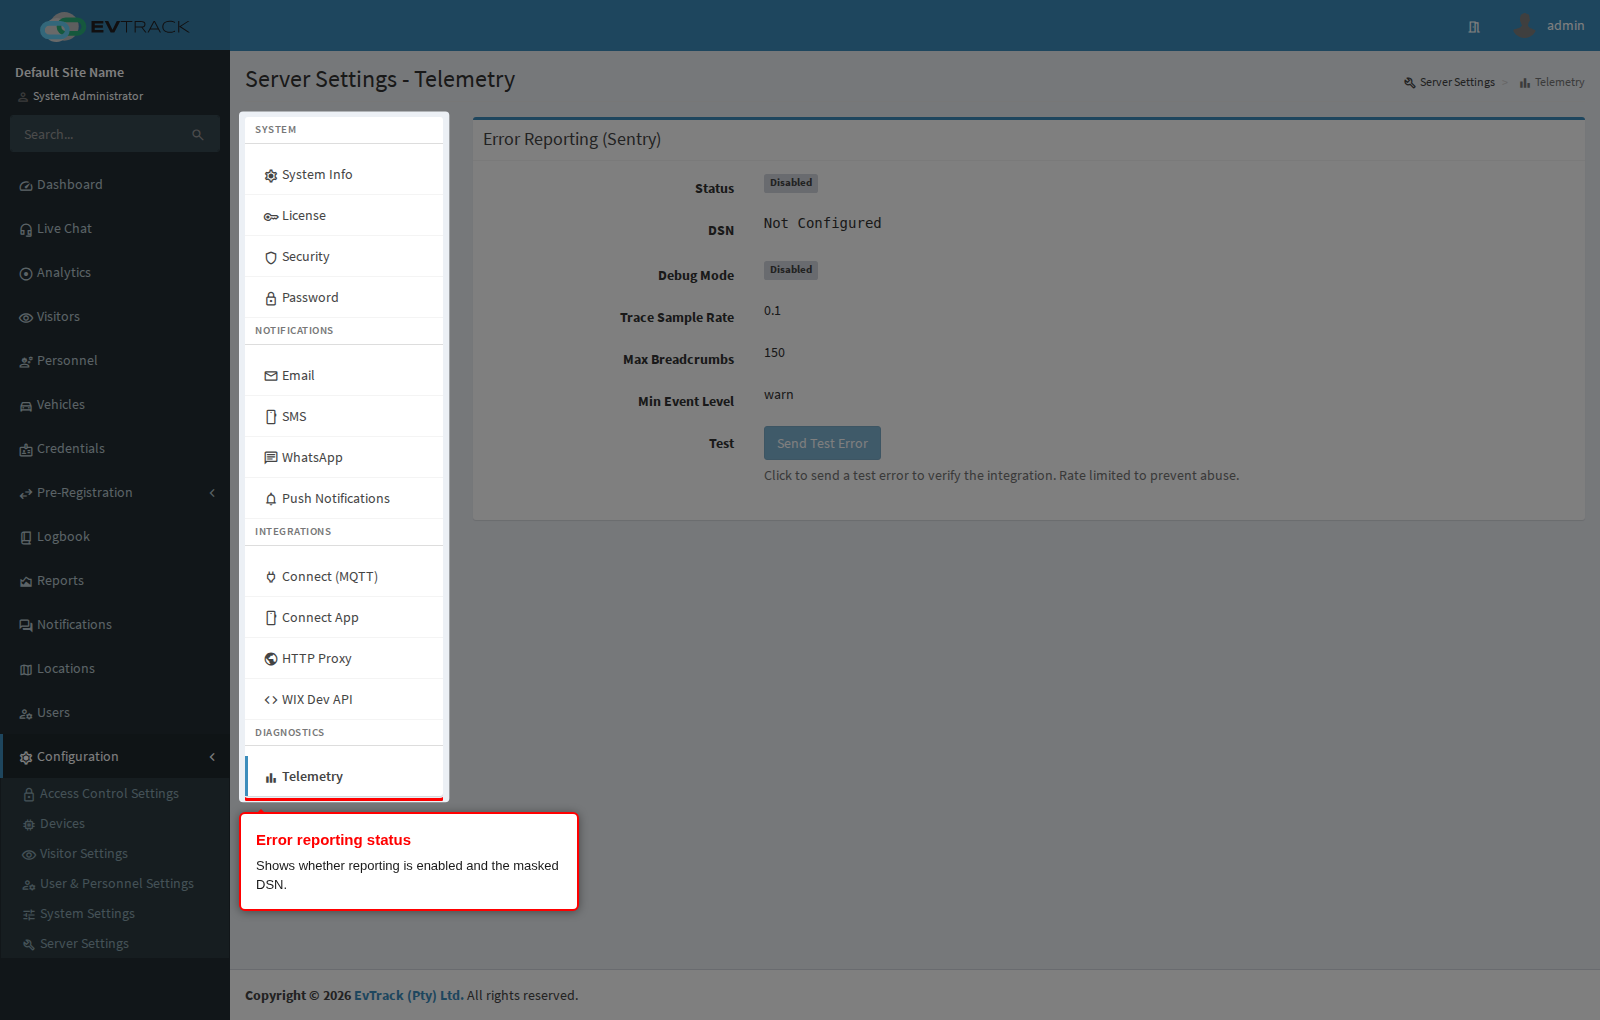
Open Configuration > Server Settings > Telemetry. The panel shows the reporting Status (Enabled once a DSN is set), the DSN with its secret part masked, the debug mode, trace sample rate, max breadcrumbs and minimum event level.
Step 3: Send a test error
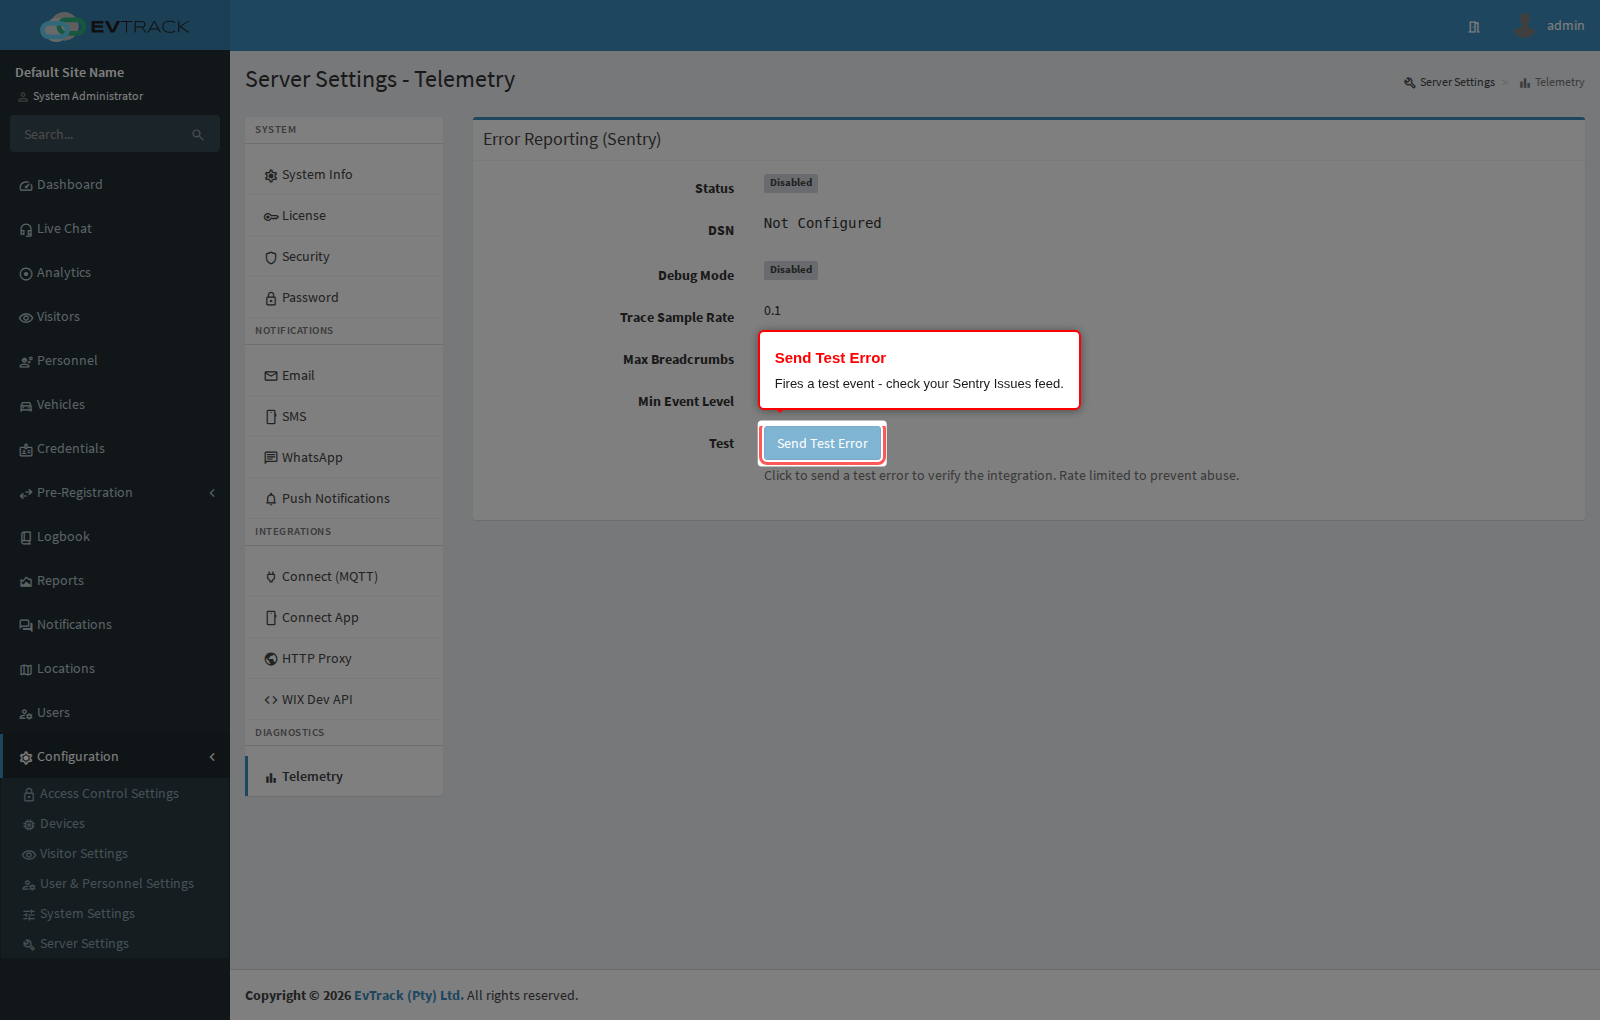
Click Send Test Error - the button is enabled only while reporting is configured, and it is rate limited. Then open your Sentry project’s Issues feed: the test event should appear within a minute, tagged with the server’s environment.
Troubleshooting
- Status shows Disabled - the environment variable is not reaching the service; confirm it is set in the service’s environment (not just your shell) and that the service was restarted.
- Test error never arrives in Sentry - the server cannot reach the Sentry ingest endpoint; check outbound HTTPS/proxy rules (Proxy settings), and enable
SENTRY_DEBUGto see the delivery attempt in the server log. - Too much noise - raise the minimum event level or lower the trace sample rate via the corresponding
sentry.*properties inapplication.properties.